bettair Air Quality Mapping (bAQM)
“The tool that any city dreams of having”
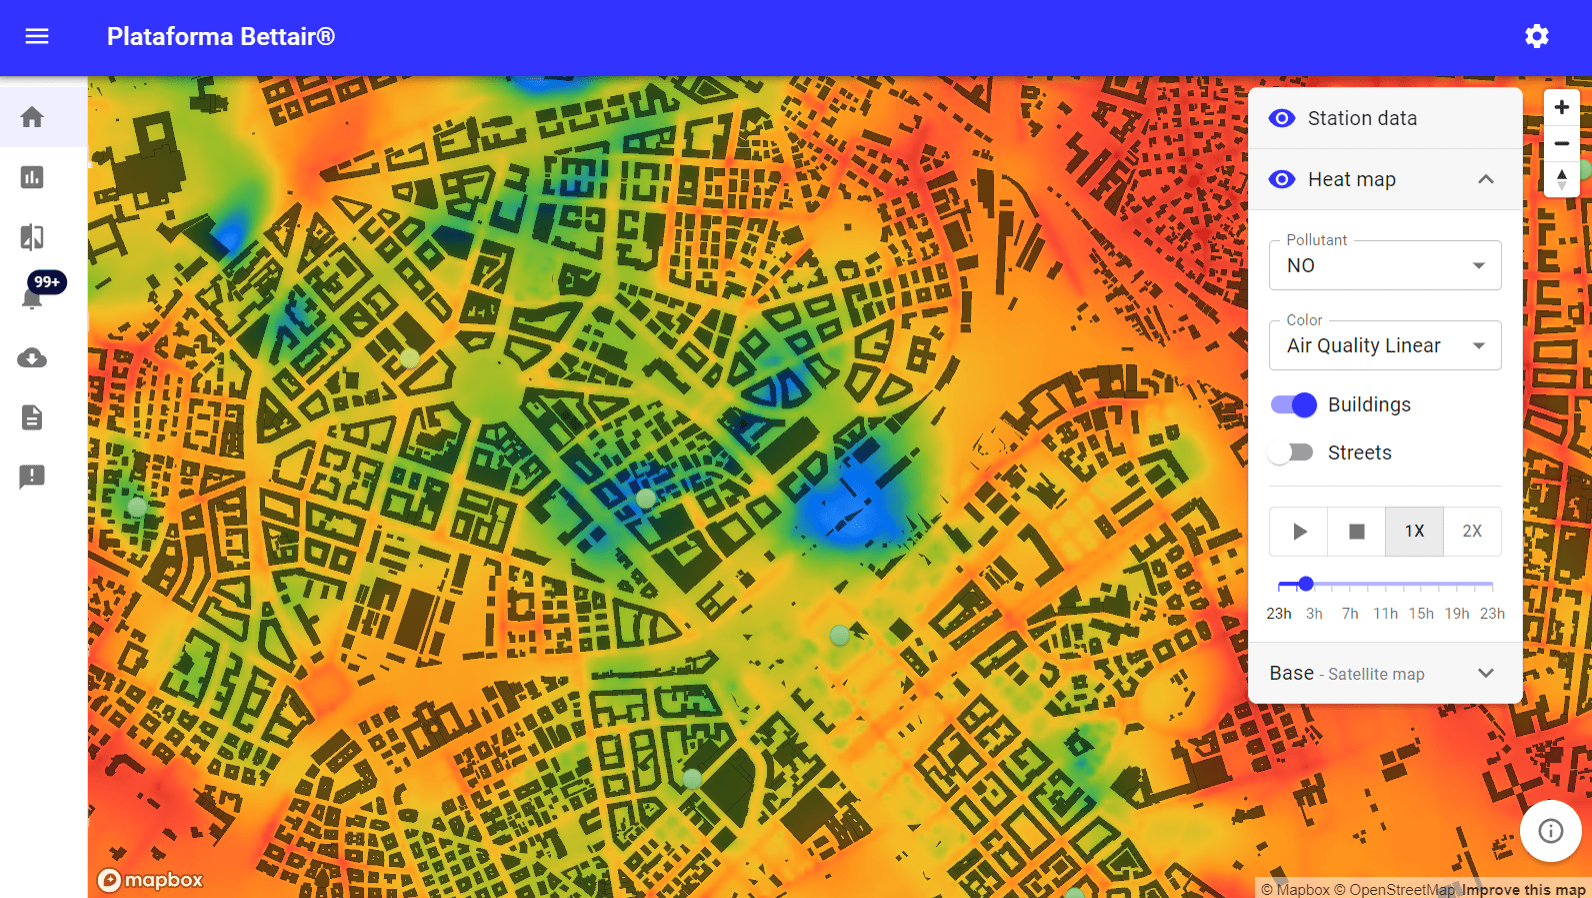
The BAQM service generates pollution maps using an urban air quality model based on established scientific models and can reach a spatial resolution of up to one cubic meter. This model takes into account emissions from traffic and local industry, as well as background pollution carried by the wind from outside the city, and allows accurate interpolation of what is happening in city streets and squares. All this from measurements made by any type of air quality measurement instrument.
The data obtained by this model make it possible to estimate the actual traffic emissions of each street segment and this allows to disaggregate the contributions of the different emission sources on each point of the map.
An awsome powerful service
Unlike other services, BAQM can be automatically deployed in the cloud to model any point of the world geography in a simple, agile and transparent waytowards the client thanks to the automation of data ingestion and preparation that Bettair has developed. In this way the information can be processed in near real time providing high quality air quality data with high spatial resolution.
The BAQM service opens up access to a huge and complex amount of information and therefore provides different automated data analysis services, without human intervention, which can be accessed through the platform’s graphical interface. The information is made available to the client on three different levels:
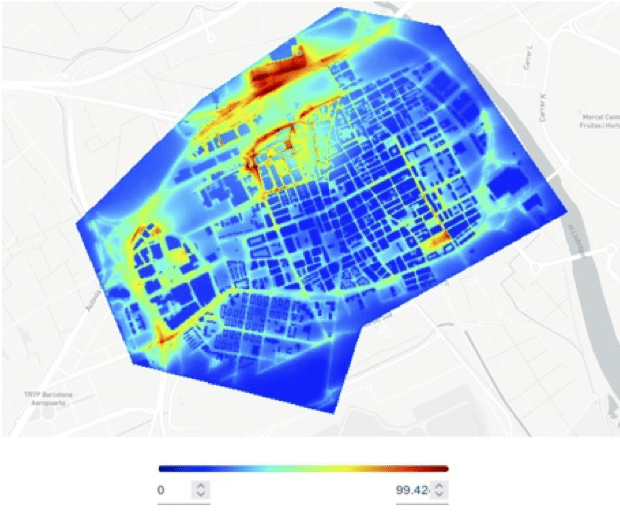
- An intuitive graphical user interface for quick data browsing.
- Configurable automatic reports:
- Street level concentrations and emissions summarizing the main characteristics of the modeling area. The time period to be analyzed, the type of day, the time zone and the area to be analyzed can be configured. A segmentation of the modeling area by land use type is included, and for each area the main air quality characteristics are summarized, as well as background concentration levels and traffic emission profiles.
- Comparisons between two data sets: For example, the variation of emissions and concentrations at street segment level between two different time periods over the modeling area can be evaluated. You can configure the time period to be analyzed, the type of day, the time slot and area to be analyzed, and the meteorology. Comparisons can also be made between two areas of the modeling zone.
- Downloadable data to be processed by other independent analysis tools.
This information gives access to a new dimension of services as it allows the user to acquire and generate actionable knowledge on the fly in order to improve the air quality of the study areas. This is possible because the service provides data in near real time, every hour, which allows for an agile evaluation of situations that have attracted attention in a simple and intuitive way.
It’s not a simple interpolation of data, it is radically more
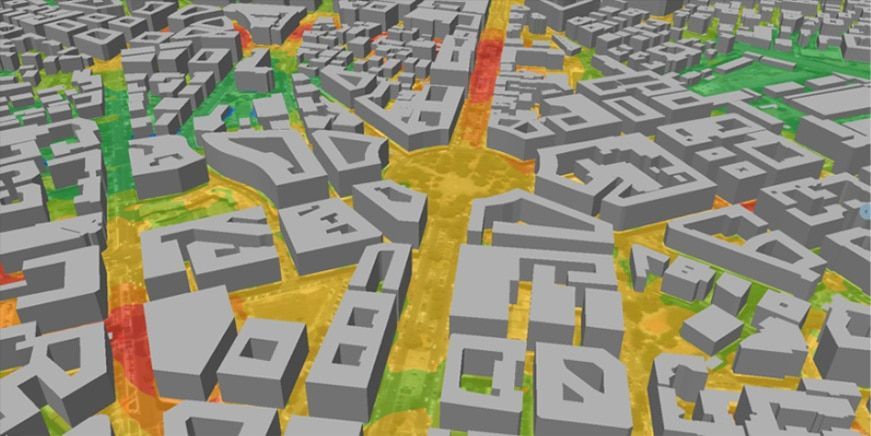
Urban geometry model
Once the implementation area has been selected, a 3D model of the urban area is built. This model contains the description of the plan of the buildings, their height, the width and length of the streets, the green areas, the areas with water and the land uses (industrial, commercial, residential…)
Meteorological pre-processing
This component is responsible for using standard regional (or mesoscale) meteorological data and urban surface characteristics to calculate values related to boundary layer and micrometeorological data. Once these data are calculated, they are used as input variables in the dispersion module. This module is based on AERMET but has been modified to adapt it to urban environments by a joint team of researchers from Bettair Cities and experts in physics and atmospheric mechanics from the Barcelona Supercomputing Center.
The modifications that appear in the algorithm with respect to the AERMET formulations arise mainly to provide the model with the capacity to capture the effect that heat fluxes have on the dispersion of pollutants. First, a parameterization of radiation in urban environments has been incorporated and then a calculation of the different heat fluxes found in cities.
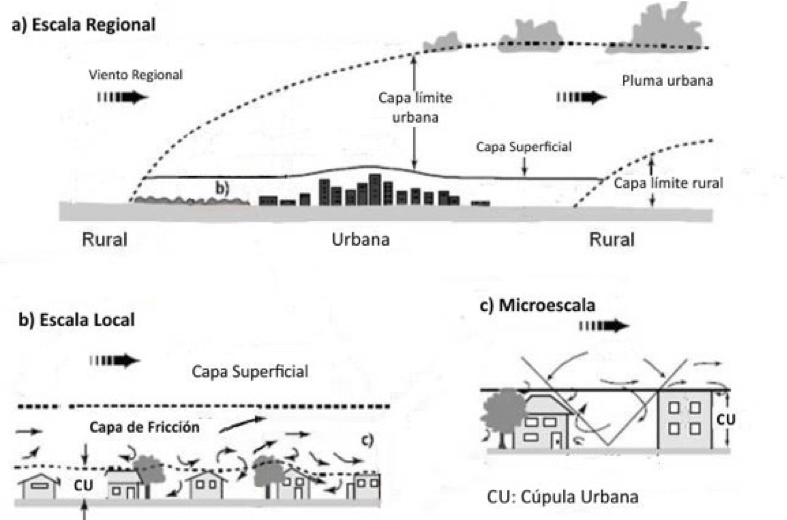
Dispersion algorithm
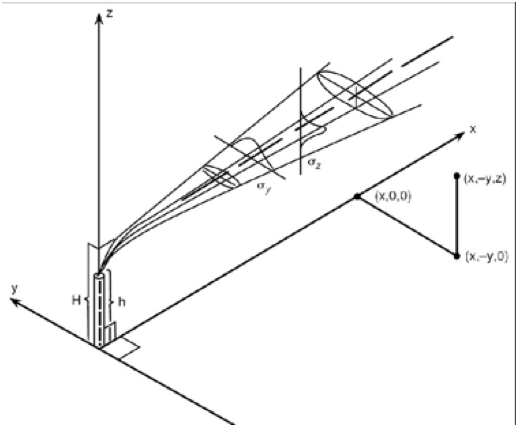
The Bettair scattering model is based on scattering algorithms, optimized for portability and computational efficiency. This model is capable of simulating point emitters and emitters as segments. The algorithm simulates the dispersion of pollutants emitted by a point emitter as a Gaussian plume.
The advanced calculation carried out in the meteorological preprocessing takes into account the micrometeorology and heat fluxes of the area, distinguishing, for example, if the dispersion happens in a park, or in a square without green areas, the shape of the plume will be affected by the heat fluxes of the ground in one way or another. In addition to all this, the calculation of the contributions of the actual traffic flow at each point at any given time is added to the above.
It’s not a flat representation, it is a 3D modeling
To take into account the 3D geometry, the algorithm bettair incorporates different modules that model the behavior of pollution in urban canyons. The map generator determines the wind behavior between buildings. This wind flow has a determining factor in the final concentration of the pollutants.
In areas with buildings on both sides of the road, very different wind flows are created than in clear areas. For example, in a street flanked by two tall buildings where the wind blows perpendicular to the street, vortices are created that hinder ventilation and accumulate pollutants.
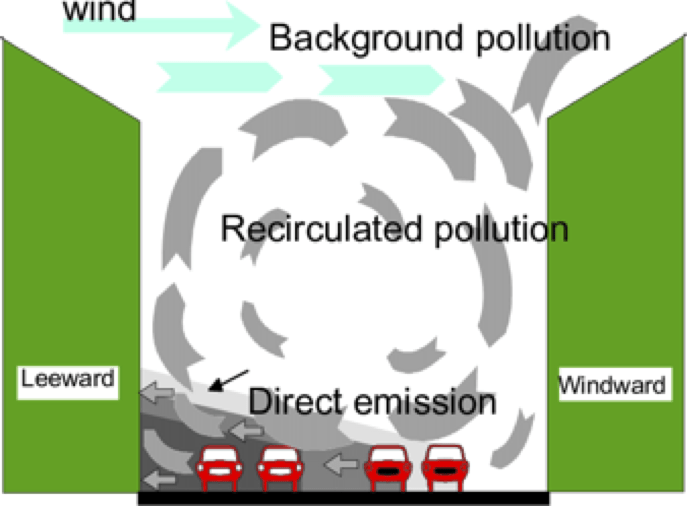
This has been validated initially, repeatedly, in experimental simulations in wind tunnels, but was also verified later in urban areas in Barcelona, the USA, Germany…
The bettair model takes into account urban canyons using an Artificial Intelligence (AI) module for Computational Fluid Dynamics (CFD) simulations. This module has been developed in collaboration with the Barcelona Supercomputing Center (BSC) and has been awarded with the prestigious Hyperion Research HPC Innovation Excellence Award.

Integrates the contribution of traffic, but also of the rest of contributions
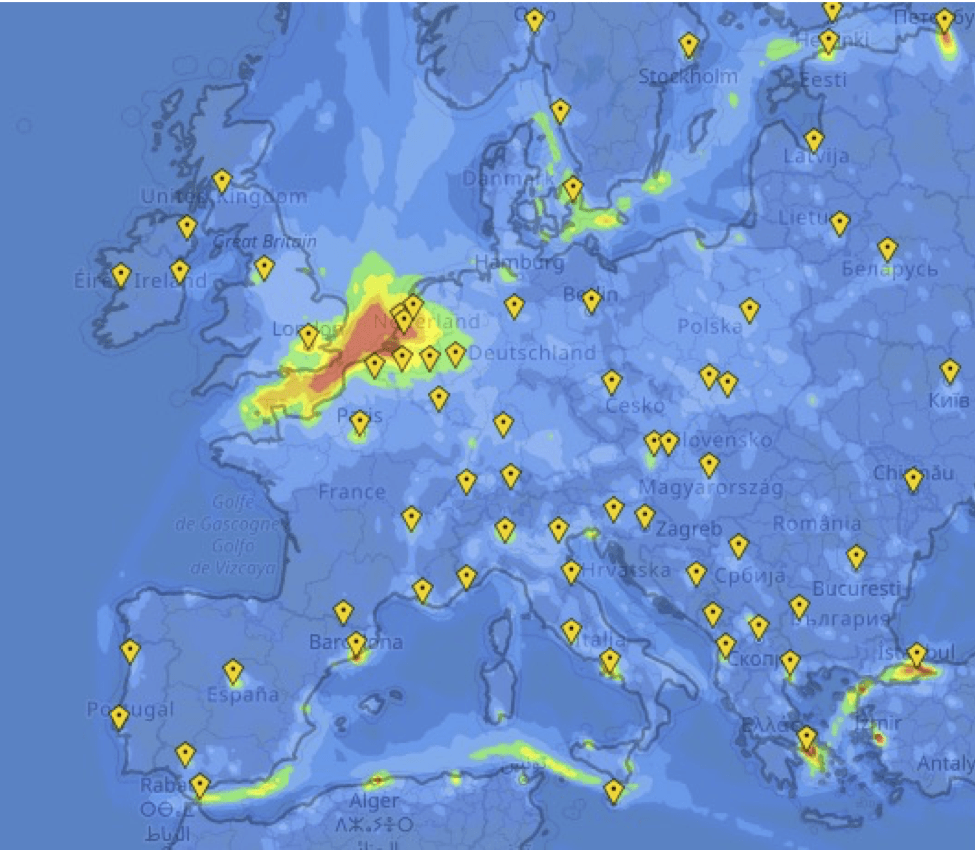
The bettair model takes this variable into account thanks to data received from the Copernicus Atmosphere Monitoring Service (CAMS), which provides us with the ability to continuously monitor the composition of the Earth’s atmosphere on both global and regional scales. These data are generated from satellite observations, ground station observations and meteorological model ensembles.
Bettair has created a data assimilation algorithm that takes into account the short-term historical behavior at Bettair stations to disaggregate the traffic component of the pollution levels measured by Bettair instruments. This allows the measured concentrations over the entire modeled area to be divided into three classes:
- Concentration due to traffic.
- Concentration of background (regional transport).
- Concentration of other unknown local sources (e.g., aggregate from construction sites, parking lots, workshops, restaurants, loading and unloading areas…).
Modeling primary gases… and secondary ones
Real-time traffic and emissions
The classic method is to use inventories of the car fleet in the area, along with estimates of what each type of car emits and estimates of the number of cars passing on each street. These inventories and estimates have the disadvantage of always being outdated and not accurately representing what is seen on site.
In order not to rely on these inventories, we take advantage of real-time measurements through Bettair nodes. These data feed the dispersion algorithm and allow estimating the actual emissions generated by the vehicle flows passing through each street segment.
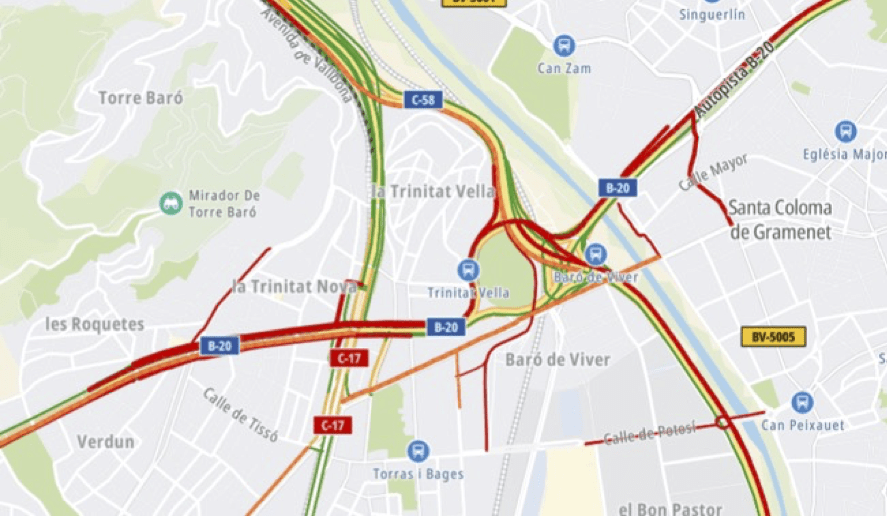
Traffic Data Provider is used to predict the car density on each street. The data arriving in real time reports the average speed on each street and at Bettair we use this information to calculate the density of vehicles on the stretch of street, with machine learning algorithms and graphs, which are built on the historical data.
For the estimation of emissions we use the observations obtained from the Bettair node data. To do this, we look for a constant emissions profile in time and space. What is done is to estimate an emissions profile for each type of street (service, residential, tertiary, secondary, primary, highway…) and each hour of the day.